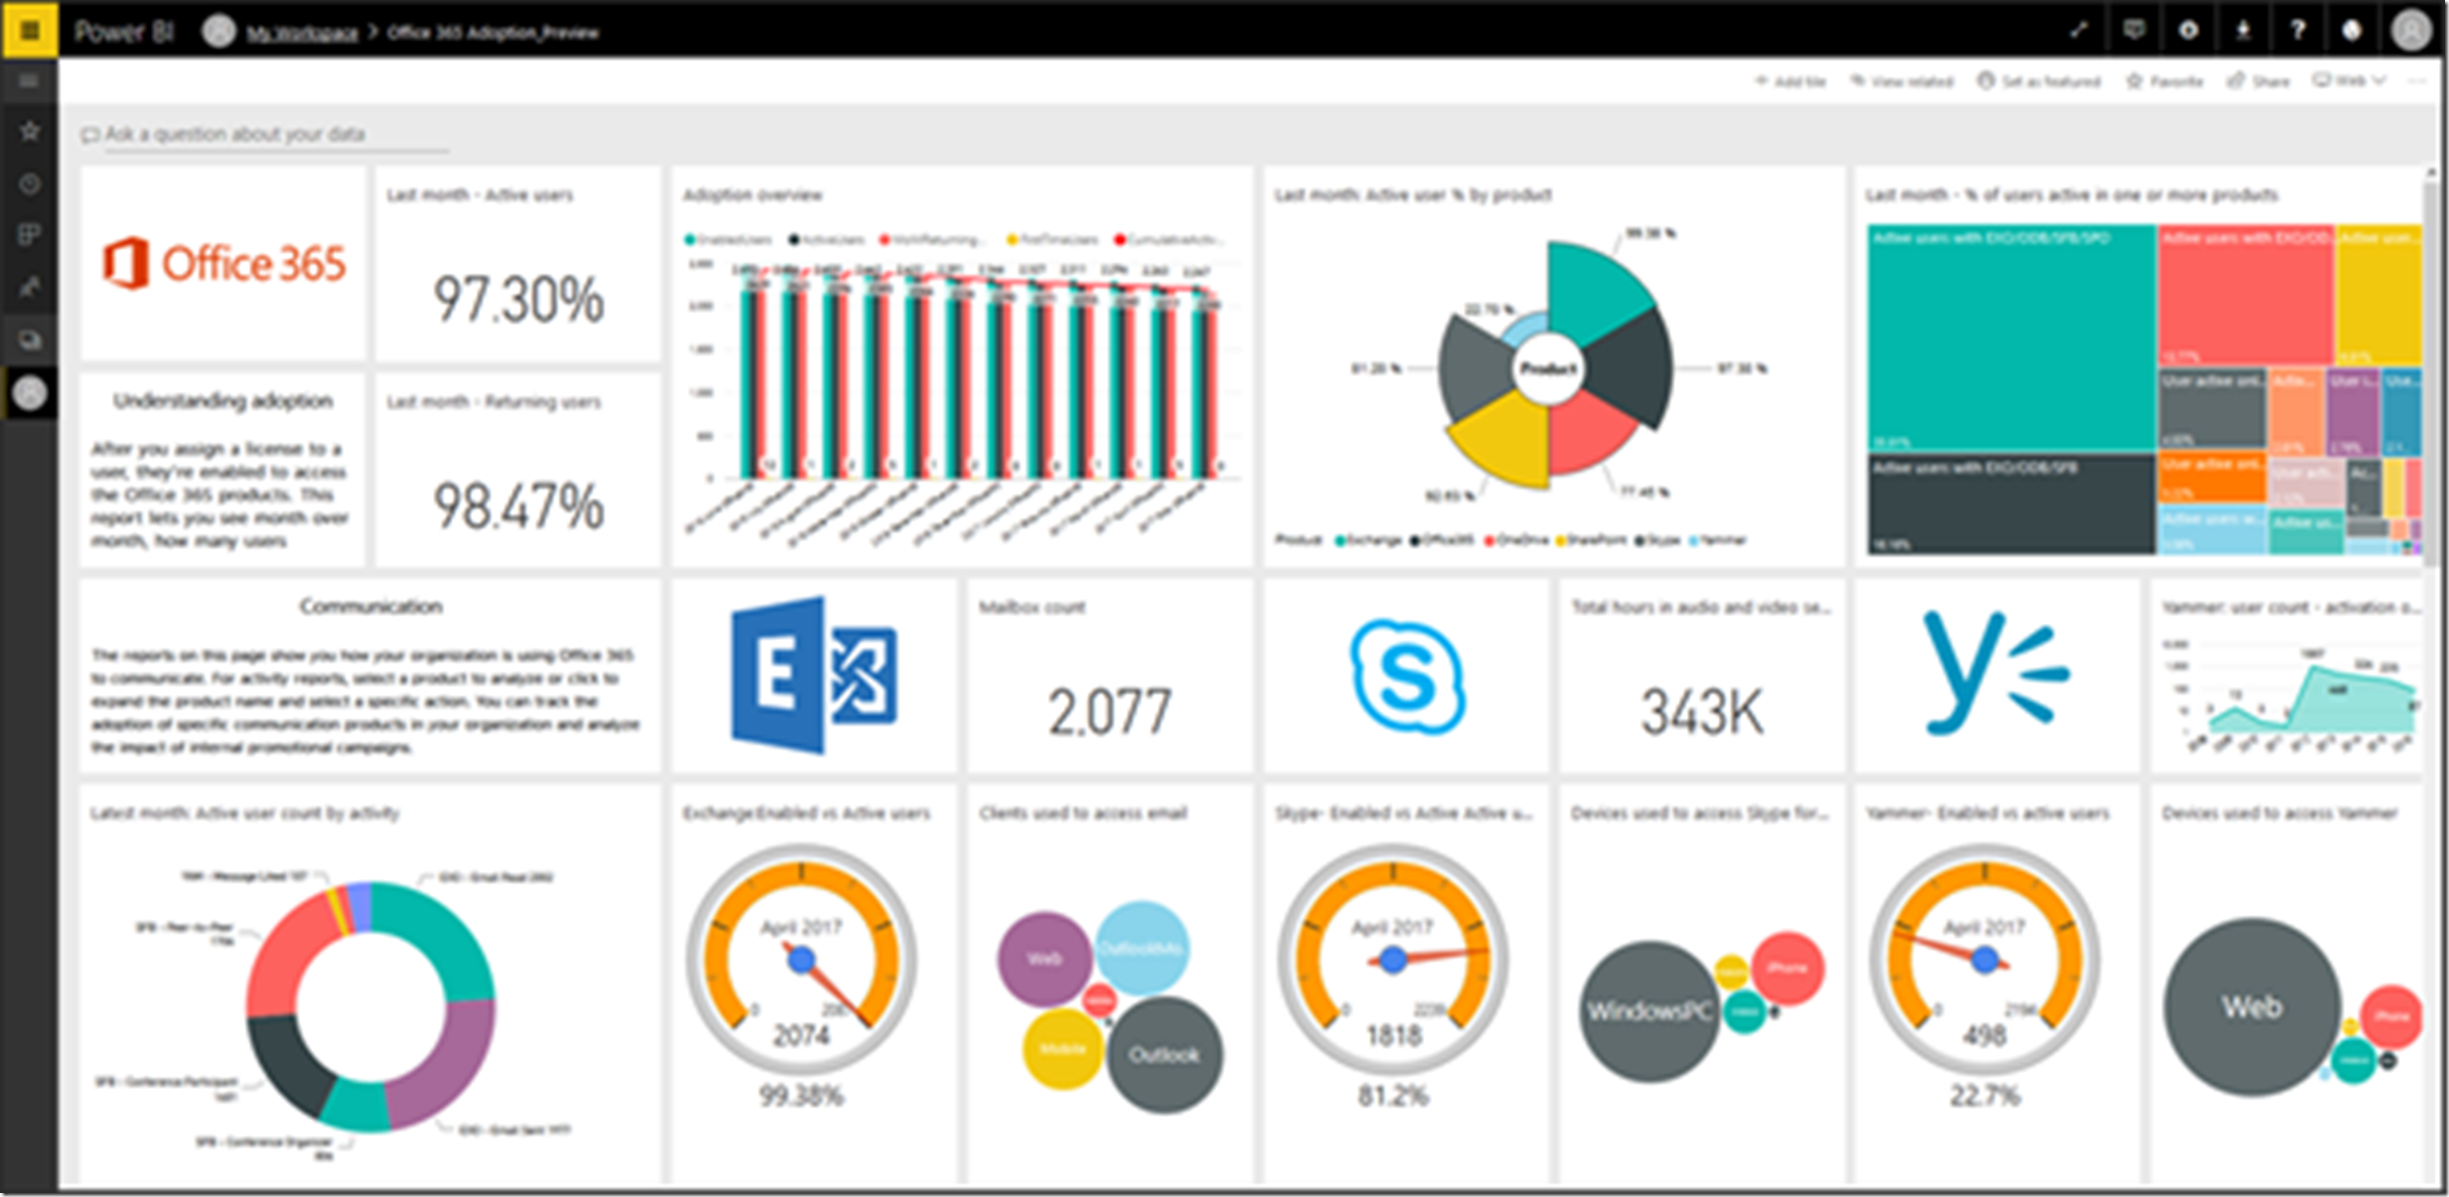
Microsoft Power BI is a free cloud-based data analytics tool consisting of services, apps and connectors used to transform isolated pieces of data into cohesive, visually compelling, and interactive visualizations and reports. You’re looking at a detailed tutorial on using Power BI. From this series of posts, you’ll find out:
- how Power BI services and apps are working together;
- how to use Power BI to enhance your business performance;
how to create interesting visuals and reports.

Introduction
Whether you’re using Microsoft Excel or hybrid data centers (cloud or on-premises) to store your data, Power BI allows you to easily connect to a variety of data sources, clean and visualize your data, and share the results with whomever you like.
Power BI is a fast and easy way to creating neat datasets, reports, and visualizations using data from Excel files or on-premises database. Also, Power BI is a smart tool for companies which is commonly used for real-time data modeling and designing individual solutions. You can benefit from Power BI as your personal visualization and reporting tool. At the same time, Power BI can be used as an analytics and decision making tool by project teams, departments, and entire organizations.
If you’re making your first steps in Power BI, be sure to carefully read this tutorial. If, however, you’re lucky to already have some experience with Power BI, this article will help you systematize your knowledge and fill in the gaps.
Power BI components
The Power BI pack includes the components — Power BI Desktop, which is a standard Microsoft Window app, Power BI service (SaaS), and Power BI Mobile for smartphones and tablets running on Windows, Apple iOS, and Google Android.

These three components enable users to create, use, and exchange analytical business data for personal and professional purposes.
Power BI and your role in the project
You approach to using Power BI depends on your function in the project or team. Keep in mind that people in other positions and with other responsibilities may be using Power BI in a different way, which is totally fine.
For instance, your only way of using Power BI may be to view reports and dashboards. At the same time, your colleague, who is involved in numeric data processing and business reporting, will probably spend much of their time using Power BI Desktop much to connect, model, and visualize data from different sources. Your other colleague from the sales dep may be actively using Power BI Mobile to track sales targets and study new customer prospects.
The beautiful thing is that you can use different Power BI components depending on your tasks and contribution to the project.
For example, you can view data on stock or production progress on a real-time dashboard in Power BI Service. Or you can benefit from the extensive capabilities of Power BI Desktop to make a client relations report for your team. While having access to all Power BI modules, you can choose the tools and features that serve you best at the moment.
In the upcoming posts, we’ll focus on each component and give you a better insight into Power BI Desktop, Power BI Service, and Power BI Mobile, one by one. Also, we’ll guide you through creating a report with Power BI Desktop, sharing and viewing it on mobile.
Workflow in Power BI
Generally, you start with creating a report in Power BI Desktop. Then you publish the report in Power BI Service to make it available to Power BI Mobile users.
While this is not the only possible sequence of steps, we’ll use it to explain how Power BI components operate and complement each other.
Now that we’ve reviewed Power BI and its tools, let’s see how to use them.
How to use Power BI
As you’re discovering the functionalities of Power BI, keep in mind that there is a standard procedure for working in Power BI:
- import data to Power BI Desktop and create a report;
- publish the report in Power BI Service, where you can create and configure data visualizations and dashboards;
- share dashboards with your organization, including mobile users;
- view public dashboards and reports in Power BI Mobile.
As already mentioned, it’s OK if you’re only using Power BI to view visualizations and reports created by your team mates or co-employees. We’re exploring the whole array of Power BI capabilities to help you find out which tools might be useful to you personally. The decision is always yours. Remember there is no such thing as the only right way to use Power BI.
Stay tuned!